

Wastewater science has grown beyond the SARS-CoV-2 pandemic with routine public health metrics evaluating influenza, respiratory syncytial virus (RSV) and mpox.
“The COVID-19 pandemic put tremendous strain on public health resources, but through collaborative, nationwide approaches in wastewater analysis, we now have cost-effective epidemiological techniques to monitor for potential disease cases,” said Katherine Ensor, Rice’s Noah G. Harding Professor of Statistics.
“Looking retrospectively from the onset of the pandemic to the present, we are using lessons learned to estimate disease trends and understand uncertainty quantitatively,” said Ensor.
Ensor is a co-author of a research paper with collaborators at Rice, the Houston Health Department, and Houston Public Works that used two statistical techniques to investigate variability in sampling and lab measurements and changes in the population disease dynamics.
Ensor, known globally for her work in mathematical statistics and methods in computational analysis, specifically in areas of time series and spatial processes, has worked jointly with Houston Health Department’s Chief Environmental Science Officer Loren Hopkins and the department’s Data Science Division on numerous special projects in state-space modeling and statistical process control frameworks.
The most recent paper, published in the open-access journal Scientific Reports in March 2024, uses a dynamic non-linear state-space time-series model to quantify the impact of sampling and measurement error. A second statistical process control model detects when there are deviations between sewershed and sub-sewershed facilities.
“We found that the combined statistical techniques give broad insight into whether sub-sewershed time series provide different public health information from large, centralized wastewater treatment plant time series,” said Ensor.
The research also includes an online algorithm that supports the real-time statistical assessment of deviations of virus level in a population represented by a sub-sewershed to the virus level in the corresponding larger downstream wastewater treatment plant.
“Since sub-sewersheds capture a smaller population, the online algorithm provides the ability to identify when measurements differ from centralized wastewater treatment plant trends, which could help identify actionable information on where outbreaks may be occurring,” said paper co-author Julia Schedler, a research scientist at Rice University.
Schedler contributed significantly to the manuscript and code development. She also authored a GitHub tutorial for the online algorithm that uses synthetic data as an educational resource for other wastewater science programs.
Houston is the fourth largest city in the U.S., with a current population of over 2.3 million and a large land area that is half the size of the state of Rhode Island. The sub-sewershed facilities that serve this population, including lift stations and wastewater treatment plants, vary widely in size and customer type.
“When developing Houston’s wastewater surveillance system, we implemented quality control practices and processes for ensuring high-quality results and reproducibility,” said Lauren Stadler, an associate professor of civil and environmental engineering at Rice. “These are applied to all samples, regardless of facility size, type, or location.”
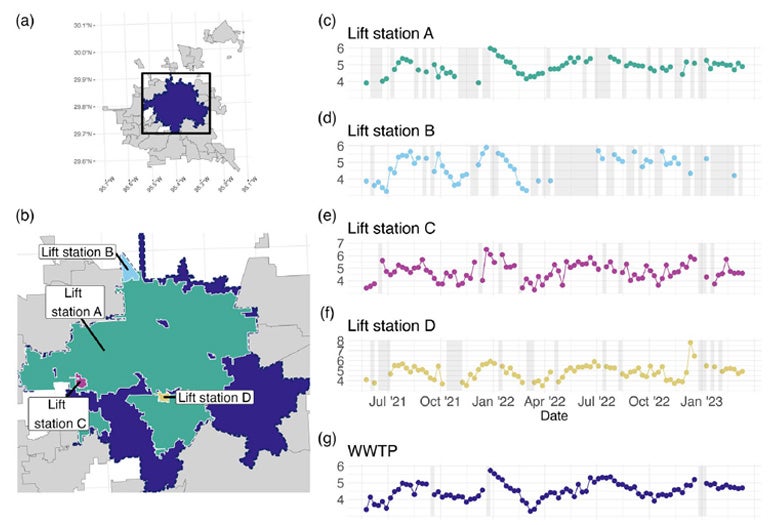
Working in coordination with Houston Public Works and the Houston Health Department, the process control and sampling for the sub-sewershed study involved weekly samples from four lift stations and a centralized wastewater treatment plant that serves roughly 551,150 people.
The study period spanned 95 weeks from May 24, 2021, through March 13, 2023. Online data on the analysis results for the lift stations and wastewater treatment plants was updated weekly. Time-series modeling estimated trends of true viral concentrations, and the information supported public health decisions by spotlighting population segments where outbreaks were occurring.
“Standard time series methods successfully account for correlation over time in the observed series of wastewater concentrations but may only estimate a single source of variation in the observed wastewater viral measurements,” said Ensor. “This work focuses on separating the sources of variability in the measured virus level into the variability in the trend and the variability from the sampling and measurement processes.”
Ensor says the Houston algorithm addresses four goals: retrospective estimates of the disease trend using all available data, online estimates of the disease trend using only past data up to a given time point, forecasts of the disease burden for one to two weeks, and real-time identification of when a location shows higher disease burden, even when very little data is available for that location. Valid statistical uncertainty measures are provided in each case.

The second statistical process control model detects when there are deviations between sewershed and sub-sewershed facilities. The above images visualize the control charts.
Additional co-authors and analysts who contributed to the paper in multiple ways include Rice postdoctoral associate Thomas Sun, Houston Health Department analysts Rebecca Schneider and Anthony Mulenga, and Rice postdoctoral research associate Jingjing Wu.
As a CDC National Wastewater Surveillance System (NWSS) Center of Excellence, Houston Wastewater Epidemiology works extensively with the CDC and its National Wastewater Surveillance System (NWSS) and the Water Environment Federation (WEF).
This past May 21, WEF and Houston Wastewater Epidemiology co-hosted a cross-sector workshop, held at Rice University, on Resource Optimization Strategies and Data Actionability for health departments, public laboratories, and wastewater utilities with the Environmental Protection Agency and Health and Human Services regions four and six. These regions encompass Alabama, Arkansas, Florida, Georgia, Kentucky, Louisiana, Mississippi, New Mexico, North Carolina, Oklahoma, South Carolina, Tennessee, Texas and 72 tribes.
Shawn Hutchins, Communications Specialist