
The Houston Health Department has launched updates to the City of Houston Wastewater Monitoring Dashboard, an online infectious disease surveillance system that monitors disease trends in communities.
Managed by Houston Wastewater Epidemiology – a team of collaborators with the Houston Health Department, Rice University and Houston Public Works – the dashboard was initially launched as a COVID-19 response platform on September 22, 2021. The system retroactively includes data from when the collaboration began collecting and analyzing wastewater data for viral levels of SARS-CoV-2 in May 2020.
To date, the Wastewater Monitoring Dashboard has consistently reported weekly viral load magnitude of SARS-CoV-2 and variants of concern across all major COVID-19 surges. The dashboard has received widespread use by health care providers, government and public health agencies, news outlets, and school districts for its community-level assessment of symptomatic and asymptomatic cases without relying on the testing of individuals.
The dashboard has also led to a rapid increase in public assess to public health metrics. According to Google Analytics, over 220,000 people have visited the dashboard, which displays viral load measurements by zip code or from 39 city-owned wastewater treatment plants that serve more than 2 million people.
From the start of the pandemic, a Rice team led by Farès el-Dahdah, a professor and director of the Spatial Studies Lab, and Ualas Rohrer, geographic information system specialist, has applied geospatial thinking and platforms to design and maintain the dashboard.
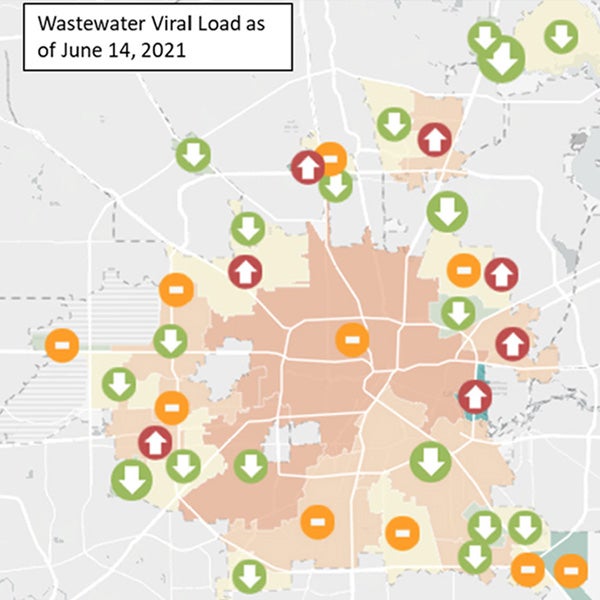
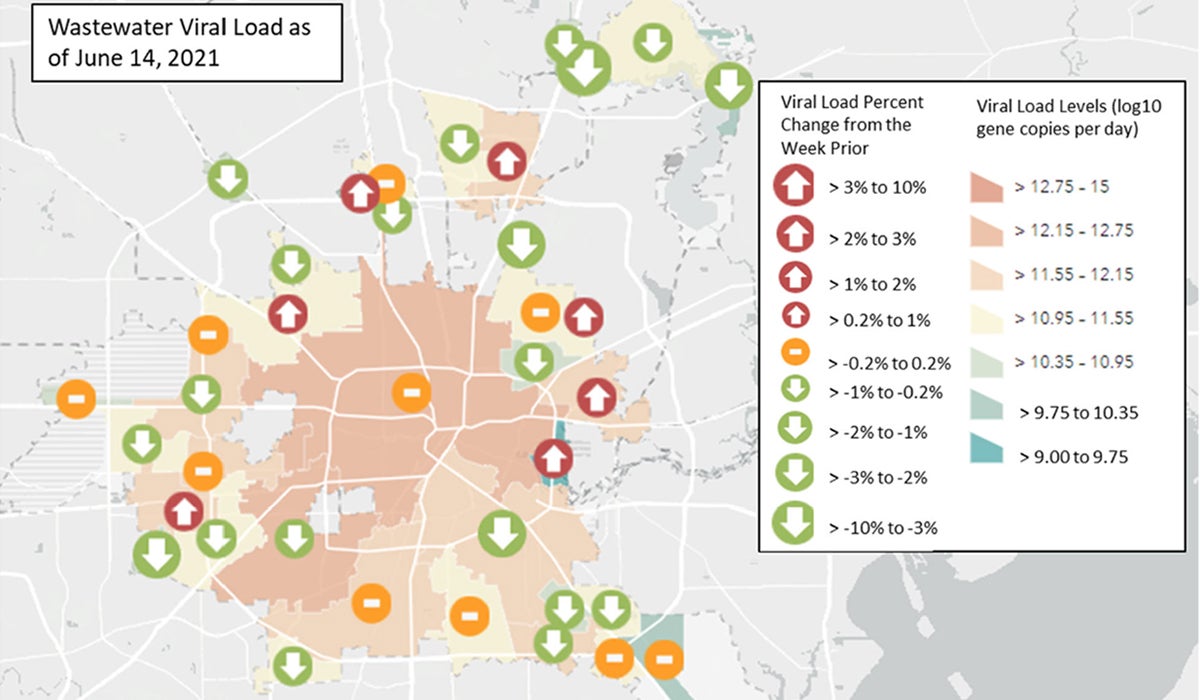
Dashboard data is conveyed by an interactive map of Houston that is color-coded according to the weekly level of SARS-CoV-2 viral loads and arrow symbols on the wastewater treatment plants. The size of the arrow represents the magnitude of the one-week change. The panel on the right displays viral load as compared to the benchmark date, the positivity rate for the city and each of the wastewater treatment plants, the unvaccinated rate, and a scroll bar for viewers to see the progression through time. At the bottom of the map is a tab for advanced statistics.
“A major component of dashboard 2.0 includes a school report that provides SARS-CoV-2 and influenza trend information for 51 of HISD schools,” said Loren Hopkins, chief environmental science officer for the Houston Health Department and a professor in the practice of statistics at Rice.
The Houston Independent School District (HISD) has led all school districts in the nation in participating in wastewater surveillance.
Hopkins says, “the dashboard has been an important part of targeted response and planning by city officials, public health departments, school board members, and hospitals. It has also provided timed information for Houstonians to assess the prevalence of COVID-19 or influenza in their community and compare current levels with previous surges or declines in viral load.”
A new school report section on the dashboard reflects this focus. New research published online on January 20, 2023, in Water Research presents the results of a 17-month wastewater monitoring program for SARS-CoV-2 and influenza A and B in preK-12 schools.
School wastewater monitoring operates much like municipal wastewater treatment plant monitoring. Weekly composite wastewater samples are collected from a manhole over a six-hour time frame during school hours. The samples are analyzed by laboratories at the Houston Health Department laboratory and at Lauren Stadler’s Rice laboratory to determine if SARS-CoV-2 or influenza fragments can be detected in a sample. Results are uploaded weekly to the dashboard.
Stadler is an assistant professor of civil and environmental engineering, whose research focuses on wastewater-based epidemiology, environmental antibiotic resistance, wastewater treatment and resource recovery, and environmental synthetic biology.
Another important component of the dashboard update shows cross-correlation analysis to assess leading or lagging relationships between the wastewater viral load and other metrics, such as seven-day averages for positivity rate, emergency department visit rate, general hospital bed rate and ICU bed rate.
Since January 2021, this weekly analysis has been performed by Rebecca Schneider, an analyst with the Houston Health Department, and Katherine Ensor, the Noah G. Harding Professor of Statistics at Rice.
“This element of the dashboard update reflects Houston’s multi-institutional efforts to integrate and evaluate a citywide surveillance system, said Ensor. “Our studies have shown that wastewater SARS-CoV-2 viral loads strongly correlate with trends from multiple disease indicators. This element is crucial to identifying potential outbreaks early on.”
The updated dashboard has also incorporated a few changes from public feedback. In addition to improving the overall user experience, the team has added a search feature on the map that allows users to find their local wastewater treatment plant when searching by their address.
The dashboard is part of a widespread national initiative. The Centers for Disease Control and Prevention (CDC) launched the National Wastewater Surveillance System in September 2020 to help coordinate and build upon those efforts.
As a member of the National Academies’ Committee on Community Wastewater-based Disease Surveillance, Hopkins and other ad hoc committee members across the U.S. are examining the value of wastewater surveillance as a tool to trace, prevent, and control the spread of infectious diseases beyond COVID-19. Additional reports are part of a multi-institutional initiative by the Rockefeller Foundation’s Pandemic Prevention Institute (PPI).
Shawn Hutchins, Communications Specialist